|
The imaging quality of the lens is yingyoumen most concerned is the most debated topic, although a variety of lens imaging quality for the test method after another, but because test conditions differ, so these methods are not very accurate reaction shots of real quality. And media capture resolution standard plate test methods, MTF curve is determined by the imaging lens manufacturer in the most objective and rigorous testing environment measured and announced, is the lens image quality the most authoritative and objective technical reference basis. Heres an overview of the technical principles MTF curves and interpretation methods.
Measuring contrast and resolution
As we all know, digital photo imaging quality for greatest impact is the lens resolution and contrast. Resolution is measured in line pairs / mm (lp / mm), two adjacent lines can be referred to as a black and white line pairs per millimeter to distinguish the number of pairs is the resolution. How to test the lens resolution and contrast it? Manufacturers use shooting sinusoidal gratings (test target in black and white grid) method for testing the brightness by sinusoidal periodic pattern called "sinusoidal gratings." The density of the sinusoidal grating is called "spatial frequency" (Spatial Frequency), spatial frequency in units of lp / mm representation. lp / mm identification unit length (per mm) in accordance with the sinusoidal variation of the luminance pattern of cycles.
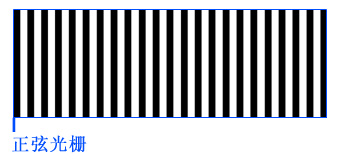 Let us look back contrast. Contrast = (maximum illuminance - illuminance min) / (max + illuminance illuminance minimum). Therefore, the contrast value is always less than or equal to 1. Here we introduce the concept of modulation M: M = (Imax - Imin) / (Imax + Imin) modulation of M is always between 0 and 1, the greater the modulation, the greater the contrast. In contrast and resolution of the lens when tested, we will sinusoidal grating is placed in front of the lens, measured at a modulation imaging lens. Then because the lens aberrations, the following occurs. When the spatial frequency is low, the measurement of the modulation of M sinusoidal grating is almost equal to the modulation; when taken sinusoidal grating spatial frequency increases, the modulation of the imaging lens gradually decreased. Lens imaging with spatial modulation frequency change function is called modulation transfer function MTF (Modulation Transfer Function). Modulation to the original sinusoidal grating of M, if the image plane through the lens to reach the modulation degree of the image of M , the MTF function value: MTF value = M / M Thus, MTF value must be greater than 0 and less than 1 . MTF value closer to 1, indicating that the more excellent the performance of the lens. MTF of the lens can not only reflect the contrast resolution of the lens can be reflected. Since MTF values are manufacturers rigorous test environment measured, excluding the imaging medium (film or sensor) effects, thus more objective. When the spatial frequency is low, MTF tends to 1, then the MTF value can reflect the lens contrast. When the spatial frequency increases, that is, increase the density of the sinusoidal grating, MTF value is decreased, when the MTF curves reflect the resolution of the lens. Because the human eyes ability to distinguish limited, we generally take the MTF value is 0.03, the spatial frequency as the visual resolution limit of the lens. Spatial frequencies below this value, the change in the quality of the lens imaging the human eye is difficult to detect, the measurement does not exist meaning. Determine the quality of the lens using the MTF curve 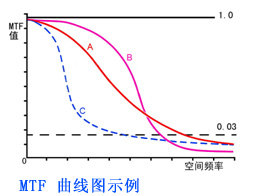 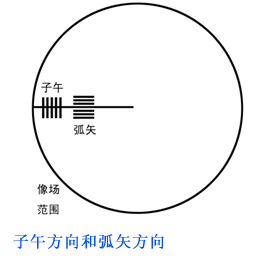
| Above case, for A, B, C three MTF curves following analysis: Curve A represents the lens contrast medium at low frequencies, but with the spatial frequency increases, its decay process is very slow, indicating that the quality is good the. Curve B represents the low-frequency performance of the lens is very good, good contrast lens described, but with the spatial frequency increases, the attenuation curve which quickly, indicating resolution of the lens is not very good. Curve C represents the lens quickly attenuation at low frequencies, the overall quality is lower. And the upper curve different vendors draw MTF curves are fixed spatial frequency and aperture. Including fixed spatial frequency low-frequency (10 line pairs / mm) curve represents the characteristics of the lens contrast, this curve is higher, the greater the contrast lens. The fixed-frequency (30 line pairs / mm) resolution characteristics curve represents the lens, this curve is higher, the higher the resolution the lens. Though the ordinate is the value of MTF, the abscissa to the center of the image field of the distance to the measurement point. Optical axis of the lens is a symmetrical structure, the center of the image quality in all directions are the same variation. Since aberration factors, the image field of the image field of a point farther away from the center, the MTF value is generally downward trend. Therefore, in order to center the image field from the edge of the image field as abscissa, may reflect the edge of the lens imaging qualities. In addition, the deviation from the center of the image field, the tangential direction along the radial direction of the lines and the lines of a sinusoidal grating the MTF measured values are different. Parallel to the generating lines of the diameter of the MTF curve is called the sagittal curves labeled S (Sagittal), and the tangent line parallel to the generating curve of the MTF curve is called radial, labeled M (Meridional). Thus, the MTF measured manufacturers generally have two curves, the S curve and the M curve. |
Various manufacturers MTF chart legend Published by various manufacturers MTF curve has its own characteristics. Nikon Corporation announced the MTF curve is measured when the maximum aperture of the lens, where the solid line is measured by the S direction, measured in the direction of M dashed, blue for the spatial frequency of 30 lp / mm, the red line is the spatial frequency of 10 lines pairs / mm |  | ßCanon has announced the MTF curve solid line is measured in the S direction, measured in the direction of M dashed black curve is the measured maximum aperture, the blue curve is the F8 aperture measured, thick line is the spatial frequency of 10 lp / mm when measured, thin is the spatial frequency of 30 lp / mm when measured. |  | ßSigma Corporation announced the MTF curves measured at maximum aperture, where the solid line is the S direction measured, measured in the direction of M dashed, green for the spatial frequency of 30 lp / mm, the red line for the spatial frequency of 10 line pairs / millimeters. |  |
Recognize and read about the MTF curve, to note summarized as follows:
1, MTF curve and the horizontal axis, a space surrounded by the vertical axis, the larger the area the better. MTF curve is flat as possible, explanatory straight edges and the central part of the lens imaging uniformity
2, S curve and the M curve as close as possible
3, low frequency (10LP/mm) curve represents the lens contrast, high frequency (30LP/mm) characteristic curve represents the resolution of the lens
4, Do not use different focal length, different grades and different specifications (full frame, APS-C format) as well as various fixed focus and zoom lens MTF chart to compare because they are affected by the characteristics of the design specifications, optical properties, as well as cost aberrations , a great influence on the materials used, not comparable. Only the same grade, the same size lens MTF chart that has the comparative significance.
5, Do not mix different manufacturers lens MTF curves are compared, as announced by the manufacturers of the MTF curves are in their test environment measured, and differences in the test environment. In short, MTF curve is not a panacea, it can only interpret the lens contrast and resolution characteristics, can not be determined, such as anti-glare, distortion and other characteristics. Yingyoumen MTF curves in a reasonable interpretation, we must remain rational and objective attitude.
|